A report showing 99% purity leaves an important question open: 99% of what measurement? Read the result together with its method, sample identifier and acceptance criteria. A percentage detached from those fields is difficult to interpret or compare.
What does HPLC actually measure?
High-performance liquid chromatography separates components before a detector records their response. An area-purity calculation relates the selected peak area to the integrated peak areas included by the method. Detector choice, integration settings and separation affect the result. The Waters LC-UV-MS example demonstrates why chromatography and mass information can be used together for peptide impurity work.
A worked peak-area example
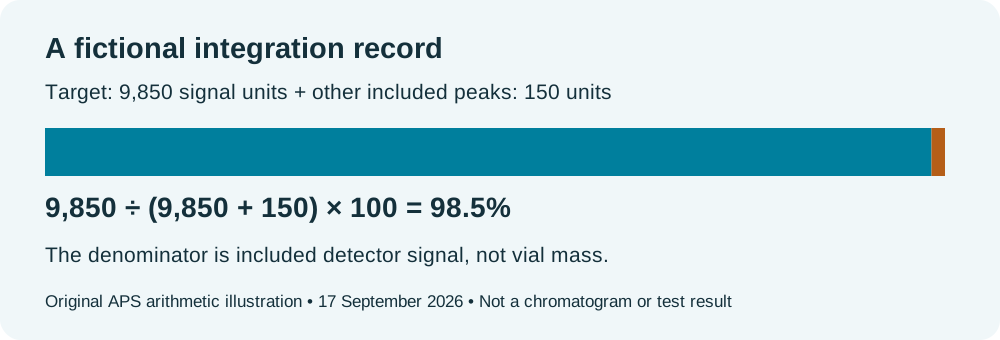
Suppose a hypothetical chromatogram has an assigned target area of 9,850 units and other included peak areas totalling 150 units. The area result is 9,850 ÷ 10,000 × 100 = 98.5%. This is an illustrative calculation, not a result for any product in our catalogue.
The denominator is integrated signal. It is not automatically the total mass of everything in the vial. Nor does a large target peak resolve every possible co-eluting impurity. Ask what the method can distinguish and what it excludes.
Purity, identity and quantity answer different questions
| Question | Record to request | Limit to retain |
|---|---|---|
| What fraction of the integrated signal is assigned to the target? | Chromatogram, integration and method | Area percentage depends on the measurement conditions. |
| Does the sample match the intended molecule? | Identity evidence, such as an appropriately interpreted mass spectrum | A name on a label is not an analytical identification. |
| How much target material is present? | A suitable quantitative assay and its reporting basis | Nominal vial mass and area purity do not replace content measurement. |
| Were other required properties tested? | Separate relevant test reports | A property absent from the report remains unestablished. |
How to read a report in six passes
- Match the report's sample and batch identifiers to the material being evaluated.
- Check the laboratory, report identifier and analysis date.
- Read the named test, units and calculation basis.
- Inspect supporting chromatograms or spectra where supplied.
- Compare the stated acceptance criteria with your laboratory's intended method.
- Record missing information as a question for the supplier, rather than filling it in from marketing copy.
Use the supplier evaluation worksheet to keep that record. It gives uncertainty its own field so a high percentage cannot conceal missing documentation.
Is 99% always better than 98%?
A one-point difference cannot be assessed sensibly without comparable methods and the requirements of the intended experiment. This article does not assign universal research grades to 95%, 98% or 99%. Define your acceptance criteria before comparing results, and retain the uncertainty associated with the measurements.
Where to go next
Use the analytical-method comparison and downloadable table to decide which missing property requires its own record.
Separate report interpretation from nominal concentration arithmetic. For compound identity questions, start with the research library; for published batch documents, use the analytical report index.